Treasury Yields Fell. Why Did Tech Keep Sliding?

US Stocks · Options · News · Views
A 0.07-Point Cushion Is No Confirmation
The S&P 500 currently sits directly on its critical 7580 watch level, with Friday's close landing almost exactly on the line. Official exchange closing data compiled by Bloomberg show the index closed at 7580.07 on October 30, down 0.57% from October 23. Friday's intraday low touched 7527.56, temporarily slipping below 7580, before closing just 0.07 point above it. That tiny margin does not confirm convincing support. While the index has not reached the 7500 defensive zone, technical levels define risk boundaries rather than predetermined paths, and market price action requires step-by-step confirmation.
The market rallied early in the week before reversing sharply. Daily bars show the S&P 500 reclaimed 7660 on October 26 and closed above 7720 from October 27 through October 29. Friday's selloff erased both key levels. What initially appeared to be a resilient high-level consolidation eroded rapidly on Friday. While the full-week loss looks modest, the sharp intraweek reversal highlights how fragile buying conviction remains at highs.
Using the same data source and October 23-to-30 closing prices, the broad-market ETF SPY fell 0.56% for the week to $755.72. Nasdaq 100 ETF QQQ lost 1.97% to $690.49, and semiconductor ETF SOXX slipped 1.40% to $471.51. Small-cap ETF IWM, however, gained 1.30% to $279.33. Pressure was concentrated in technology, while small caps retained a weekly gain. SOXX fell 8.24% on Friday alone, far more than its full-week loss. Those two periods must remain separate.
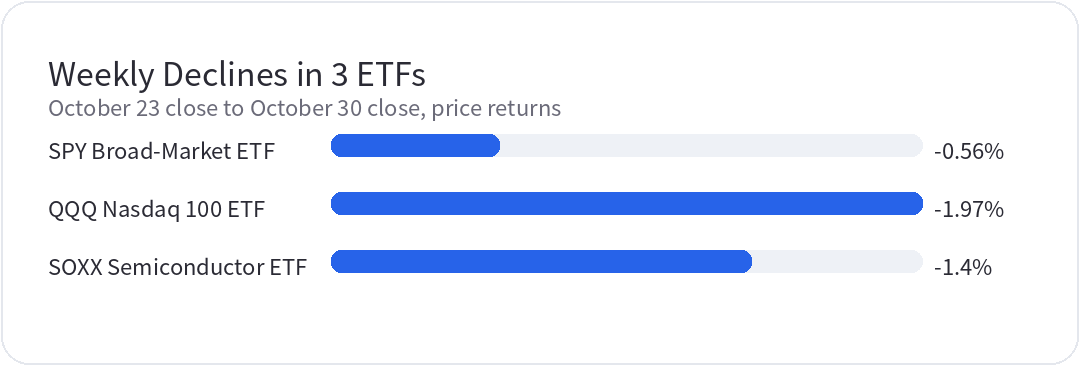
The chart uses unadjusted exchange closing prices from October 23 to October 30, 2026. Bar length represents the absolute size of each decline; the minus sign indicates a loss. All 3 securities are ETFs. IWM gained 1.30% over the same period.
Lower Yields Leave Inflation and Cash Flow Unresolved
Last week's equity decline cannot be explained by rising long-term Treasury yields over the week. The Treasury Department's constant-maturity series shows the 10-year yield fell from 5.00% on October 23 to 4.94% on October 30, a decline of 6 basis points. The 2-year yield fell from 4.69% to 4.56%, down 13 basis points. The 10-year reading did rise to 5.05% on the October 28 Fed decision day before falling over the following 2 days. Yields rose on the decision day but fell over the full week. The time windows matter.
Policy has not shifted toward easing. The Fed's October 28 statement left the target range at 3.75%–4.00% on a 10–2 vote. Both dissenters favored a 25-basis-point increase. The statement still described inflation as elevated and the pace of economic expansion as strong. Dallas Fed President Lorie Logan said on October 30 that she believed at least 2 more 25-basis-point hikes were needed. That is her policy view, not a path promised by the committee.
On October 29, the Bureau of Economic Analysis released its advance Q3 GDP estimate and September PCE data together. Real GDP grew at a seasonally adjusted annualized rate of 3.4%, versus 2.2% in Q2. The September headline PCE price index rose 0.5% month over month and 3.6% year over year. Core PCE rose 0.3% and 3.1%, respectively. Resilient growth and inflation above target offer little justification for immediate easing. Both releases followed the Fed decision; they cannot retrospectively explain the previous day's vote.
The growth picture also has limits. The same BEA monthly report shows September real consumer spending was roughly flat, while real disposable income fell 0.3% month over month. Faster quarterly growth can coexist with weaker household purchasing power in September. The 3.4% GDP reading does not establish an across-the-board acceleration in demand. Whether employment and consumption hold up will help determine how much room companies have to deliver on revenue guidance.
Energy offered little relief. Reuters' October 23 and October 30 settlement reports show the same December Brent contract rose from $116.72 to $117.64 a barrel, a weekly gain of 0.79%. Oil remained elevated. Investing's historical dollar-index table lists an October 30 close of 101.88, up about 0.07% from October 23. That small move does not support a strong-dollar liquidity squeeze as the explanation.
A 6-basis-point decline in long-term yields therefore provides only modest valuation relief. Reuters' October 30 intraday report linked the technology selloff to concerns over returns on AI investment while describing safe-haven demand for Treasuries. That fits falling stocks alongside rising bond prices, but does not establish a single cause for the week's entire decline. Whether revenue growth can cover capital spending, and profits can become cash, may matter more to technology stocks than a small decline in discount rates. Falling yields will not necessarily help if earnings expectations deteriorate at the same time.
The policy rate and long-term yields also measure different things. The former is the Fed's target range for short-term funding; the latter also reflects expectations for growth, inflation and the risks of holding longer-dated debt. A 6-basis-point drop in the 10-year does not mean every company's funding costs fall by 6 basis points, much less establish how much technology profits will improve. Claims that a specific amount of liquidity has returned would require transaction-level flow and financing data.
Elections and Jobs Put Earnings to Another Test
ISM's official calendar puts October manufacturing PMI on Monday, November 2, and services PMI on Wednesday, November 4. Both are scheduled for 11 p.m. Beijing time. US daylight saving time ended on November 1, leaving a 13-hour difference between Eastern and Beijing time this week. Summer release times no longer apply. Treasury has scheduled its quarterly borrowing estimate for November 2 and quarterly refunding statement for November 4. Debt-supply volumes and the maturity mix will offer another test of whether long-term yields can keep falling.
The borrowing estimate sets out funding needs; the refunding statement details maturity allocations. More long-duration supply could prompt investors to demand higher yields. If demand can absorb the supply, pressure on long-term yields has room to ease. The borrowing total alone does not settle the outlook for technology stocks.
Tuesday, November 3, is US midterm election day, as confirmed by the Federal Election Commission. Results will depend on each state's counting process; there is no basis for assuming all outcomes will be settled at a specific time on Wednesday. September JOLTS job openings are also scheduled for Tuesday at 11 p.m. Beijing time. Elections may change expectations for taxes, spending and regulation. The implications depend on the seat distribution and subsequent policy information. A particular election result does not automatically imply rising stock prices.
Employment is the main macro focus before the weekend. The Bureau of Labor Statistics calendar schedules preliminary Q3 productivity and unit labor costs for Thursday, November 5, followed by the closely watched October employment report on Friday, November 6. Both arrive at 9:30 p.m. Beijing time, with weekly initial jobless claims due at the same time on Thursday. On monetary policy, there is no FOMC meeting this week; the next rate decision is scheduled for December 8–9.
Technology earnings remain in full swing. Company announcements and Barron's November 1 weekly calendar list AAPL and PLTR after the US close on Monday, November 2. AMD's October 6 announcement confirms an after-close release on Tuesday, November 3, while QCOM's October 22 announcement confirms Wednesday, November 4 after the close. The focus remains whether demand guidance supports profits and cash generation. Chip companies need revenue and gross margins to improve together. Software companies need to convert growth into operating cash flow. Revenue growth alone will not establish that this pullback is over.
After each report, compare the stock's reaction with the broader market and its industry. Strong results followed by only a brief rally may indicate that expectations were still too high. If guidance is delivered and the stock holds up in a weak market, the case for recovery becomes stronger. With earnings and elections concentrated in the same week, after-hours gaps can prevent stops from executing at the intended price. Keep individual event risk contained.
Technology Must Reclaim Lost Levels Before Lower Yields Help
On the charts, 7580 remains the primary defensive watch line for the S&P 500, but Friday's intraday breakdown significantly raises the hurdle for bullish confirmation. A sustained series of closes above it, followed by reclaiming 7660, would provide greater confidence in rebound continuation, with 7720 standing as the higher-level hurdle to retake. If the index closes lower again and breaks Friday's 7527.56 low, 7500 becomes the next core area to watch. Every step requires actual price confirmation; breaking a line does not guarantee an immediate slide to the next level.
Technology's internal structure also requires differentiated analysis. Technical metrics calculated across 200 daily closes through October 30 put QQQ's 200-day moving average near $678.39, with current price still above that line. SOXX's equivalent average sits around $475.97, and Friday's close fell below it. They have not both broken below their long-term averages. A semiconductor bounce without broader technology participation would still be a localized rebound. Subsequent sessions must prove whether stabilization broadens across major tech weights. Watch first for SOXX to reclaim roughly $476, then hold around $486. For QQQ, the initial recovery hurdle sits near $696. The latter 2 are prospective watch levels requiring follow-through, not confirmed support.
If ISM and employment data show a gentle slowdown and easing wage pressure, while earnings sustain profits and cash flow, falling yields are more likely to support technology valuations. If economic data stay strong and long-term yields return above 5%, the case for chasing a rally becomes less attractive. The combination that calls for more defense is yields continuing to fall while technology loses the levels above. That would add to the possibility that earnings worries outweigh valuation relief. A sharp weakening in employment would not automatically justify buying either. It might lower yields while prompting cuts to sales and profit expectations. Watch whether technology's underperformance against the broader market narrows. Conversely, even strong data could be manageable if companies also deliver better cash generation, allowing earnings to offset some valuation pressure.
Limit risk on any single trade before major releases. Adjust exposure after price action and earnings reinforce each other. The question now is whether lower long-term yields will first help technology valuations recover or expose earnings pressure.