SOXX Split Its Shares. Did It Break the Market Too?

US Stocks · Options · News · Views
After the Plunge, Buyers Still Need to Absorb New Selling
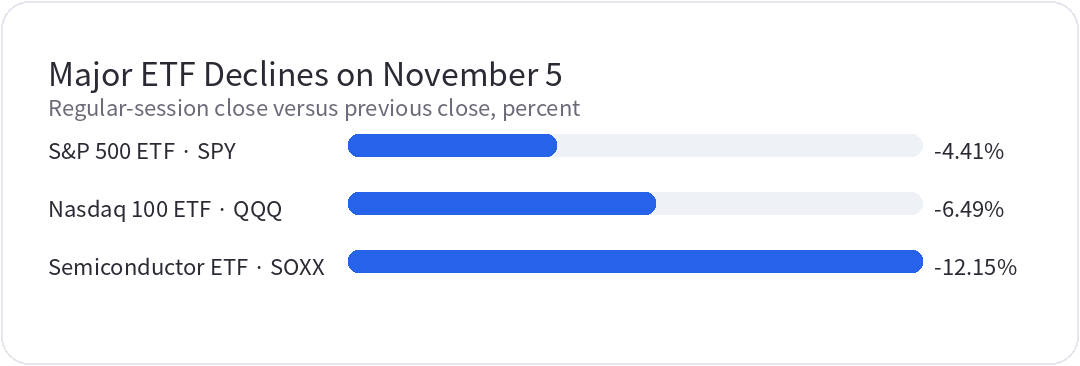
U.S. stocks fell broadly on Thursday, November 5, with technology hit especially hard. The S&P 500 fell 4.36% to 7353.73, while the Nasdaq 100 lost 6.36%. Their tracking ETFs, SPY and QQQ, declined 4.41% and 6.49%, respectively, and semiconductor ETF SOXX dropped 12.15%. The volatility index, VIX, rose from 16.61 the previous session to 28.18, reflecting a sharp increase in expected market volatility.
The size of the decline does not settle whether to buy; that depends on whether buyers absorb the next wave of selling. Even an after-hours bounce would not establish a bottom. Reducing leverage may relieve some selling pressure, but demand takes time to rebuild, so a V-shaped recovery remains unproven.
Selling Can Feed on Itself, and Its End Is Unclear
Sharp declines can set off a chain reaction. Some trend-following strategies cut exposure when indexes break key levels, risk-controlled funds reduce positions as volatility rises, and leveraged products may also rebalance. When buying interest is thin, the same sell order can cause a larger decline. Positions bought for a rebound may become another source of selling if the next downturn proves too much to bear.
These mechanisms help explain how a decline accelerates, but they do not confirm that a particular fund has been liquidated or that forced selling is over. Rebalancing exposure in leveraged ETFs is also different from investor redemptions. The two cannot be combined into a single outflow figure.
The levels of 7720 and 7130 both refer to SPX, the S&P 500 index, and serve only as conditional scenarios here. A move back above 7720 would warrant watching for a recovery in the trend and buying interest; a further decline toward 7130 would raise the risk of more selling. Neither level establishes that a particular strategy will buy or sell a fixed amount. Potential trading flows change with prices, volatility and positions, and these levels are not guaranteed destinations for the index.
Financing conditions are diverging as well. Apple set the size of its seven-part bond offering at $7.5 billion, with peak orders reportedly around $31 billion, while CoreWeave's five-year credit default swap spread rose to 1267.9 basis points. That spread measures the cost of debt protection and cannot be read directly as a default probability. Apple can attract bond orders while riskier borrowers remain under funding pressure; those orders are not buying demand for technology shares.
NFLX Holds Up Better but Still Needs a Breakout Near $65.6
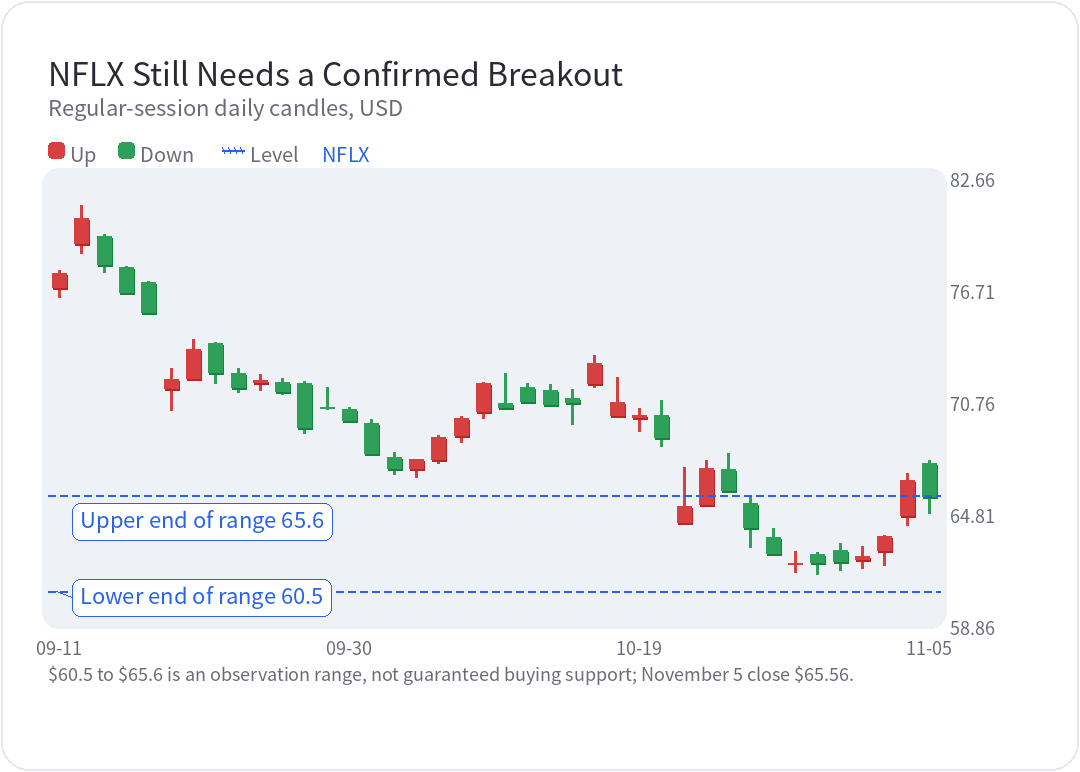
NFLX closed at $65.56, down 1.25%, substantially outperforming the broader technology market. Its business differs from the crowded trade in data-center capital spending, making it worth watching separately. The long-term case still depends on advertising revenue, subscriber retention and content spending, while new formats such as AI-generated short dramas compete for viewing time. Those risks do not disappear because the stock holds up for one session.
The near-term focus is the $60.5 to $65.6 consolidation range. The close remained near its upper end, and $65.67 is only a reference price just above that range. Price needs to hold above the falling trendline or show easing selling pressure on a retest. Proximity to the range high is not enough; a reversal needs confirmation from subsequent trading.
Under a phased buying plan, an initial half-position would mean half of the allocation planned for this stock, not half of the entire account. The remainder would wait for a confirmed breakout or buying support on a retest. If price loses the range and buyers fail to appear, the entry assumptions need reassessing. A $90 valuation for 2027 remains an untested hypothesis without a complete earnings and valuation-multiple analysis; it is neither a consensus target nor a gain already earned.
TSM Falls More Than 10% and Still Needs Buying Support
TSM closed at $353.10, down 10.78%. A lower price changes prospective returns, but it did not ease that day's selling pressure. For a plan that requires evidence of buying support before adding, the sharp daily decline does not yet justify another purchase.
Waiting for prices to stabilize can avoid the fastest part of a decline, though it can also mean missing the low. Watch whether fresh selling produces new lows, rebounds last until the close, and retests draw stronger buying interest. Better support would provide a new basis for adding in stages. When one support level breaks, the next still needs to be assessed rather than treated as an automatic buy order.
APP's Earnings Rally Puts Buying Support Near $353 in Focus
APP rallied against the broader selloff. Its November 4 third-quarter results showed revenue of $2.185 billion, up 55% year over year, with operating cash flow and company-defined free cash flow both about $1.4 billion. Fourth-quarter revenue guidance was $2.365 billion to $2.395 billion. Revenue growth converting into cash provides an earnings foundation for the stock's relative strength.
The shares rose 31.04% the next day to close at $356.10, back above $353. Watch the area around $353 for near-term buying support, with $304 to $408 as the wider observation range. A sustained move above $408 would strengthen the case for further upside, while a decline below $304 would put the rebound at risk. Valuation and advertising demand remain risks, and an exit plan belongs in place before chasing the rally.
Check Index Points and ETF Prices Before Buying in Stages
QQQ closed at $647.05. The Nasdaq 100 tracking fund first needs to stop posting lower closes, then hold a retest after a rebound. Even if it jumps after hours, the more useful test is whether it withstands the next wave of selling.
SPY closed at $733, at the upper end of the $728 to $733 observation zone; these are ETF prices per share. If that zone fails, another area to watch is 7000 to 7100 points on the S&P 500 index, which must not be confused with SPY's dollar price. The index range can help assess staged purchases of broad-market exposure, but does not guarantee a rebound. Cash needs and acceptable drawdowns should be set before placing orders.
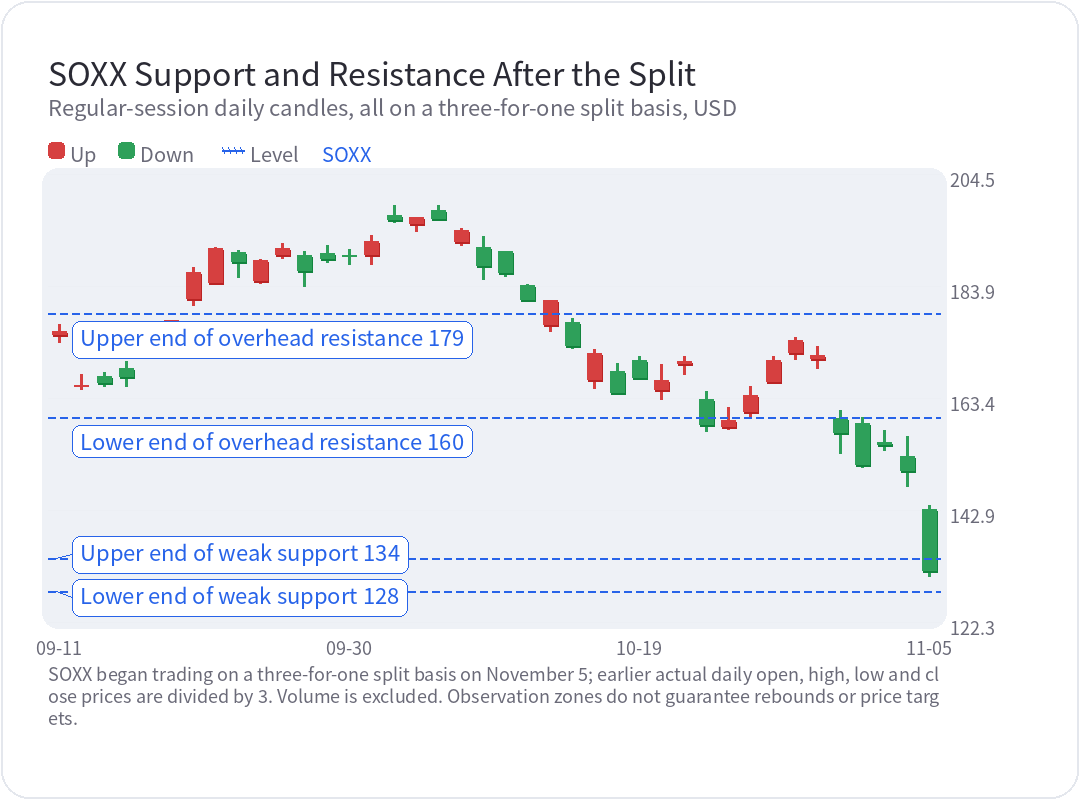
SOXX began trading on a three-for-one split basis on November 5. Share count triples and the per-share price adjusts accordingly; the split itself does not change the total value of a holding. Its November 4 close of $450.41 equals about $150.14 after the split, so the November 5 close of $131.90 represents a comparable decline of about 12.15%. Comparing $450 directly with $132 would mix two different price bases.
For now, $128 to $134 is a weak support zone, while $160 to $179 is resistance that a rebound would need to reclaim. If weak support breaks and the next rebound cannot recover it, limiting exposure remains the priority.
If rebounds fade before the close and closing prices keep falling, preserve cash and room to adjust. Even stocks that outperform need to withstand a retest before a staged entry under a preset allocation plan. The first purchase can wait; its exit conditions should be set before the order.